Selah CoCoRaHS
CoCoRaHS HCMN Project 803

The CoCoRaHS website shows the 24-hour precipitation on any given day. Photo: https://www.cocorahs.org/
Photo: https://www.cocorahs.org/
Art Crowe
Selah is a Hebrew word meaning to weigh or measure. David Bamburger, owner of Selah Ranch, gives it a slightly different meaning: To step back and take stock of what you have done. I’m in my ninth year of CoCoRaHS reporting, and I thought it was time to stand back and draw some conclusions and maybe make some predictions. But first, a little background.
What is CoCoRaHS?
Photo: courtesy March 2023 Hays Humm
The Community Collaborative Rain, Hail, and Snow Network, commonly referred to as CoCoRaHS, is a unique, non-profit, community-based network of volunteers of all ages and backgrounds working together to measure and map precipitation (rain, hail, and snow).
CoCoRaHS started in 1998 and has participation in all 50 states, Canada, and the Bahamas. https://www.cocorahs.org/ The collection of precipitation data by citizen scientists across this expansive geography provides many sources and locations of data for scientific analysis and trending.
For more detailed information about Project 803, read HCMN John Kluth’s March 2023 Hays Humm article here. And for additional tips on navigating the CoCoRaHS website, access my article, Up Your CoCoRaHS Game, near the bottom of the August 2021 Hays Humm.
Back to my data
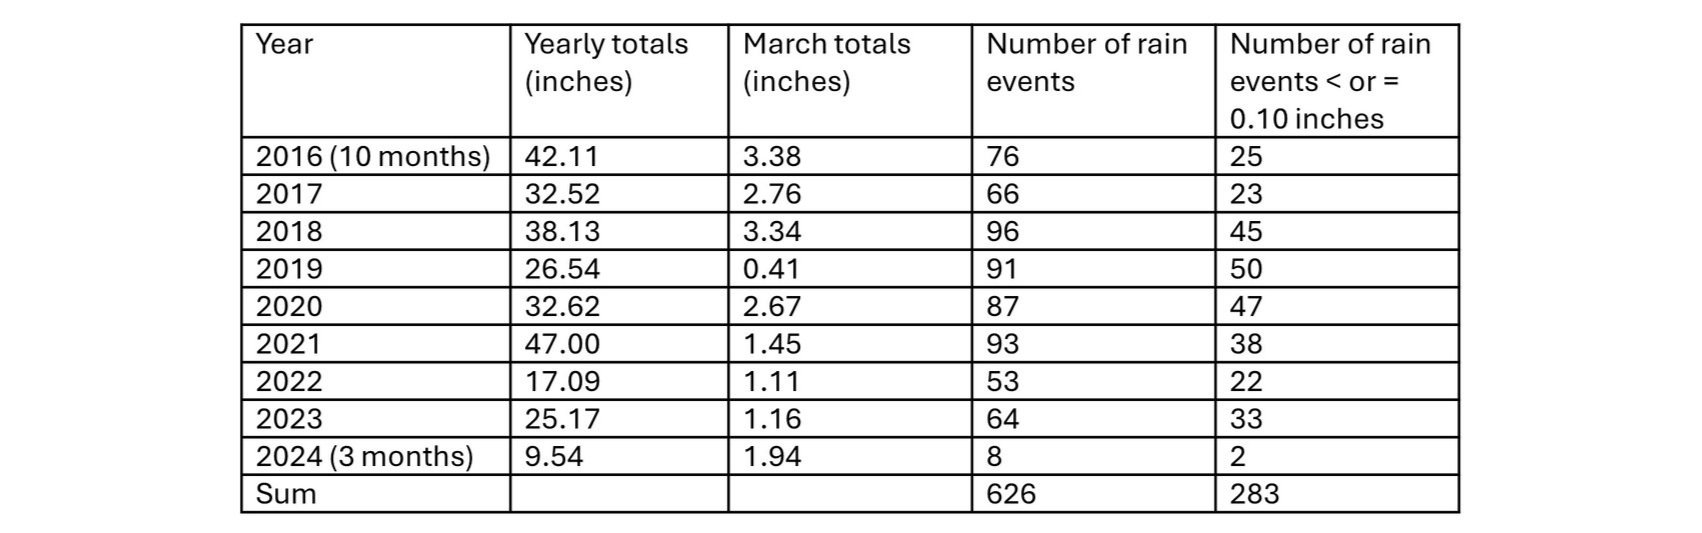
With 2,887 observations, some summary statistics are in order. It rains around my house 22% of the time. That seems like a lot. Maybe it’s because 45% of those events were less than or equal to 0.10 inch. There were 36 rain events that only recorded 0.01 inches. My wettest month (12.21 inches) was in September 2018. The wettest day (6.48 inches) was October 14, 2021. I recorded 6.11 inches of snow on February 15, 2021. The longest stretch with no rain was 59 days during July-August 2019. The second longest stretch was 43 days during July-August 2021.
I’m a big fan of doing the weekly summaries. This is where you put the past week into one of seven different categories, from severely wet to severely dry. It can be somewhat subjective, but for me it’s easy since I use the flow from the USGS gage on the Blanco River in Wimberley as my primary source. It has a 97-year period of record, which includes the drought of record during the 1950s. During November-December 2023, there were 30 straight days where new record low flows were recorded. Mildly to severely dry conditions occurred 72% of the time. From May 2022 to January 2024, I recorded 75 consecutive weeks of severely dry conditions.
Looking Ahead
It’s fun to look back at where you have been, but why not take a stab at predicting the future. My data seem to suggest that as March goes, so goes the rest of the year (except for 2021). Most weathermen would be happy to be right six out of seven times.
My rainfall prediction for 2024 is 27 to 28 inches. Let’s see how it plays out!
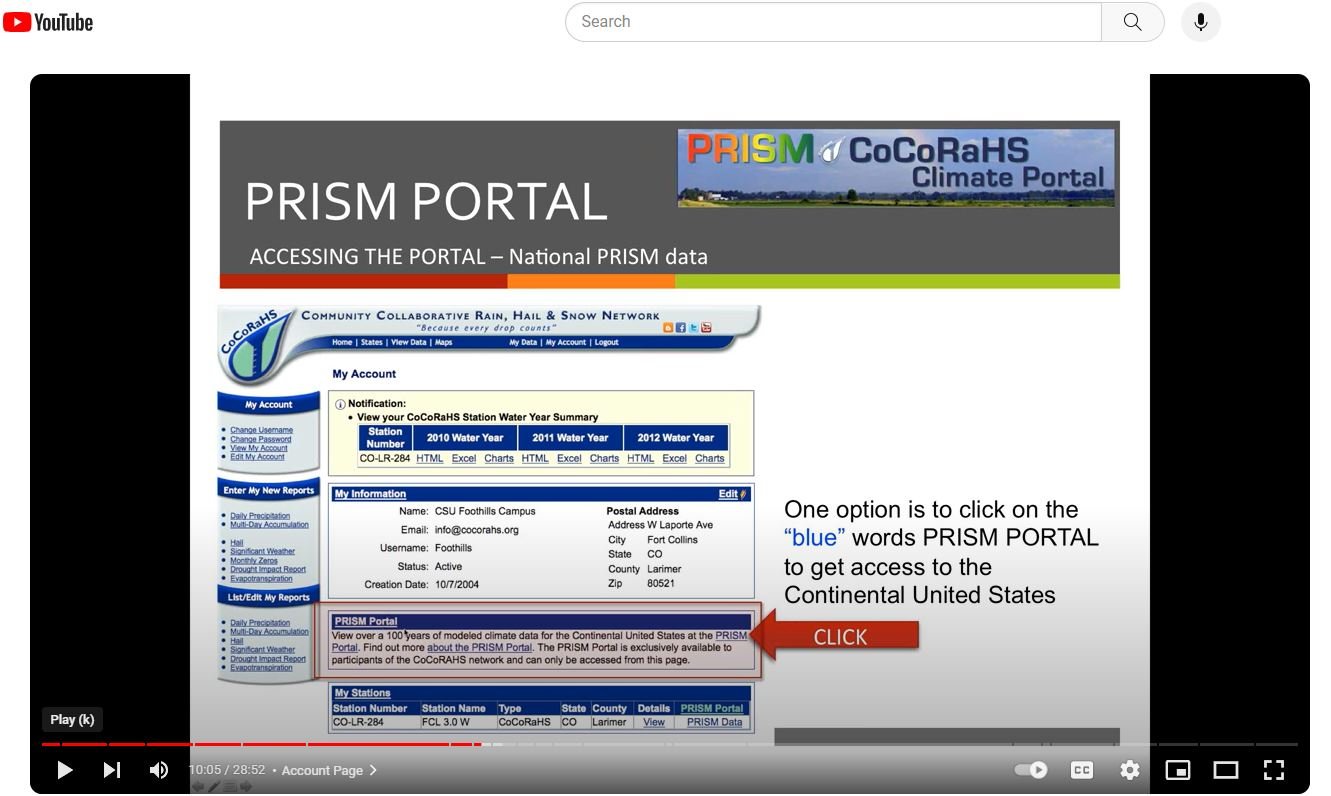
Introducing PRISM
PRISM is a powerful new tool that is available for CoCoRaHS users. It is a collaborative effort with Oregon State University to have a model of rainfall data for anywhere in the continental United States. These are based on 30-year average rainfall totals from National Weather Service Cooperative network stations. These data are updated every 10 years. The most current data set is from 1991-2020.
To access the PRISM Portal simply go to your CoCoRaHS website and click on “My Account” and then, click on the blue PRISM Portal button, which will take you to your station number. I am interested in March data. Here’s what that looks like for the latest 30-year period for TX-HYS-148.
Next, I compared the March data to the annual precipitation data for that period. Something of a correlation, maybe?
Click on an image to enlarge it to full screen.
March PRISM data for the latest 30-year period for TX-HYS-148
Annual PRISM data for the latest 30-year period for TX-HYS-148
Three screen shots at: https://cocorahs.org/Content.aspx?page=prismportal

Monthly PRISM averages provide useful information too. The fact that May and October are our wettest months is to be expected. But who would have thought that February has less precipitation on average than either July or August. These are just some of the things you can do with this powerful new tool.
Last, it’s interesting to look at the long haul. We averaged 35.4 inches over the 30-year period from 1991 to 2020.
For more information on PRISM, check out their YouTube video here.