Bat Acoustic Monitoring
Hays County
Carolyn Langlinais
Hays County Master Naturalists are participating in the North American Bat Monitoring Program (NABat) again this year. Monday is the start of another week of bat acoustic monitoring. For 9 weeks during the summer, starting May 11th and ending on July 10th, acoustic monitors are placed out on properties in Hays County. Last year, we only deployed one monitor each week and where to deploy was pretty much left up to the monitoring coordinator. This year, we have two monitors and the rules of where to monitor have become more stringent. How do we select where to deploy? I’m glad you asked.
Hays County Master Naturalists are participating in the North American Bat Monitoring Program (NABat) again this year. Monday marks the start of another week of bat acoustic monitoring (which Monday, May or June date?). For nine weeks during the summer, from May 11 through July 10, acoustic monitors are placed on properties throughout Hays County. Last year, we deployed only one monitor each week, and decisions about where to deploy it were largely left to the monitoring coordinator. This year, we have two monitors, and the criteria for selecting monitoring locations have become more stringent.
How do we decide where to deploy them? I'm glad you asked.
From the USGS website data release dated October 22, 2018, the North American Bat Monitoring Program (NABat) Master Sample and Grid-Based Sampling Frame is described as:
The NABat sampling frame is a grid-based finite-area frame spanning Canada, the United States, and Mexico consisting of N total number of 10- by 10-km (100-km2) grid cell sample units for the continental United States, Canada, and Alaska and 5- by 5-km (25km2) for Hawaii and Puerto Rico. This grain size is biologically appropriate given the scale of movement of most bat species, which routinely travel many kilometers each night between roosts and foraging areas and along foraging routes. A Generalized Random-Tessellation Stratified (GRTS) Survey Design draw was added to the sample units from the raw sampling grids (https://doi.org/10.5066/P9M00P17). This sampling design produces an ordered list of units such that any ordered subset of that list is also randomized and spatially balanced.
A recommendation from CGPT: My biggest recommendation is not grammatical but editorial: replace the full USGS quotation with a brief paraphrase, as shown below. The article becomes much more readable and keeps the focus on the volunteer experience:
According to a U.S. Geological Survey data release published on October 22, 2018, NABat uses a grid-based sampling framework that spans Canada, the United States, and Mexico. The system divides the landscape into standardized grid cells and uses a Generalized Random-Tessellation Stratified (GRTS) survey design to create a randomized, spatially balanced sampling network. This approach helps ensure that monitoring efforts are scientifically rigorous while accounting for the wide-ranging movements of bats.
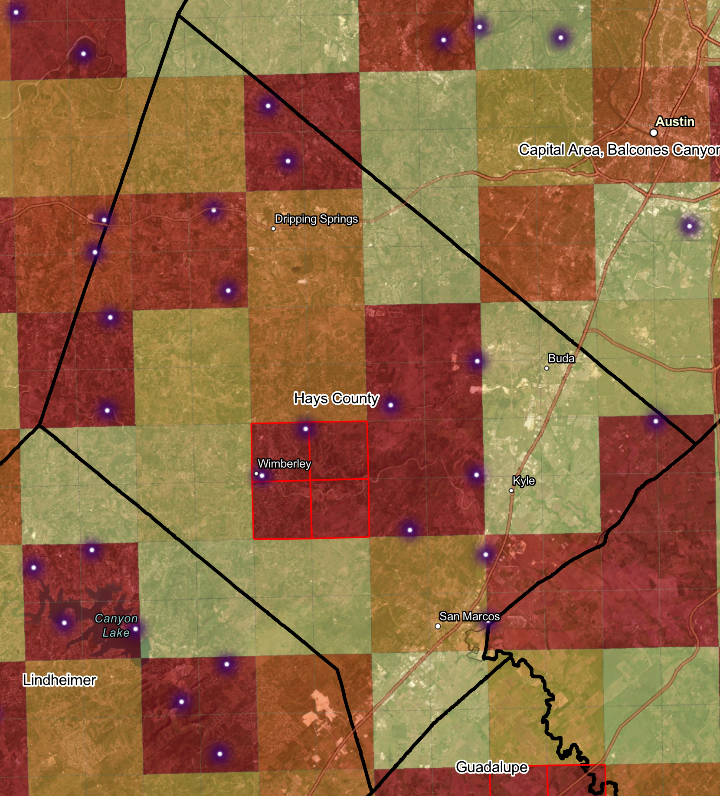
The Hays County GRTS map shows the more important grid cells in the darkest red with the lowest GRTS numbers. Each GRTS cell is made up of four quadrants: northeast, northwest, southeast, and southwest. Finding two sites to monitor within a GRTS cell for each week has been a bit of a challenge, especially given the additional parameters that require each monitor to be in a different quadrant of the cell and more than 5km from any other monitoring site.
From the map here, you can see that the two Wimberley sites are too close to each other and are in the same quadrant. An additional site will need to be found and monitored to correct this.
The Hays County GRTS map shows the highest-priority grid cells in the darkest red and with the lowest GRTS numbers. Each GRTS cell is divided into four quadrants: northeast, northwest, southeast, and southwest. Finding two sites to monitor within a GRTS cell each week has been a bit of a challenge, especially given the additional requirements that each monitor be placed in a different quadrant and more than 5 km from any other monitoring site.
From the map, you can see that the two Wimberley sites are too close to each other and are located in the same quadrant. An additional site will need to be found and monitored to correct this.
The section that has been hardest to locate sites is on the Blanco/Hays border, the triangular space with two sites that appear to sit directly on the borderline. One site I’ve gotten permission to survey is the Henly Cemetery. Unfortunately, the only other site I’ve found in this GRTS cell is less than 5 km away from the cemetery.
The area that has been most difficult for me to find sites in is along the Blanco-Hays county line, the triangular space with two sites that appear to sit directly on the border. One site for which I've obtained permission to survey is Henly Cemetery. Unfortunately, the only other site I've found in this GRTS cell is less than 5 km from the cemetery.
Finding a location involves working with the GRTS map which allows me to zoom in, but only shows roads, not business names or parks or other landmarks. So, I have a Google map on another screen and work from one to the other to narrow down locations. I found the cemetery by looking at a VRBO map and contacting the owner. She thought I wanted to book her house for the week’s monitoring! She was kind enough to put me in touch with her mother-in-law who is on the Henly Cemetery board and who also has two friends in this GRTS cell who are also interested in participating.
Finding a location involves working with the GRTS map, which allows me to zoom in but shows only roads, not business names, parks, or other landmarks. So, I keep a Google map open on another screen and work between the two to narrow down potential locations. I found the cemetery by looking at a VRBO map and contacting the property owner. She initially thought I wanted to book her house for the week's monitoring! She was kind enough to put me in touch with her mother-in-law, who serves on the Henly Cemetery board and also has two friends in this GRTS cell who are interested in participating.
The monitors we use are Wild Acoustics SM4s. The monitor is affixed to an 8-foot tall PVC pipe with the microphone zip-tied to the top. The monitor itself is screwed halfway down the pole. The wire between the two is zip-tied to the pole so that wind hitting the cord won’t create excess noise.
The monitors we use are Wild Acoustics SM4s. Each monitor is affixed to an 8-foot-tall PVC pole, with the microphone zip-tied to the top. The monitor itself is attached about halfway down the pole. The wire between the two components is also zip-tied to the pole so that wind striking the cord does not create excess noise.
The monitors are deployed on a Monday and retrieved on that Friday, depending on availability of the site. We do have some wiggle-room, but the rule is to record for four consecutive nights. In most cases, we are able to attach the monitor to a fence post or tree.
The monitors are deployed on Monday and retrieved on Friday, depending on site availability. We do have some wiggle room, but the requirement is to record for four consecutive nights. In most cases, we are able to attach the monitor to a fence post or tree.
Before deploying, the monitors are programmed with each site’s longitude and latitude in decimal degrees. Programming the monitor with exact GPS location allows it to register sunrise and sunset times. The monitor is then set to begin recording at 30 minutes before sundown and stop recording at 30 minutes after sunrise.
Before deployment, the monitors are programmed with each site's longitude and latitude in decimal degrees. Programming the monitor with an exact GPS location allows it to calculate sunrise and sunset times. The monitor is then set to begin recording 30 minutes before sunset and stop recording 30 minutes after sunrise.
When placing the monitor, it’s important to consider where bats may be flying. Bats drink on the wing, so placing the monitor where they pass on the way to a water source is a good strategy. Trees and bushes, anything that obscures the sky, is considered clutter, so finding a view that’s clutter-free is also important.
When placing the monitor, it's important to consider where bats may be flying. Bats drink on the wing, so placing the monitor where they pass on the way to a water source is a good strategy. Trees, bushes, and anything else that obscures the sky are considered clutter, so finding a location with a clutter-free view is also important.
This year, TPWD’s Texas Nature Tracker Wendy Anderson created an ArcGIS Survey123 that allows the coordinator to collect data about site conditions on a phone app. Last year, all site specifications (distance to clutter and water, weather) were filled out manually and scanned in, along with photos of the site and required permission forms, then emailed to TPWD. Now that information can be gathered in one place, stored as a draft until the monitor is retrieved, and sent through the app.
This year, TPWD Texas Nature Tracker Coordinator Wendy Anderson created an ArcGIS Survey123 form that allows coordinators to collect data about site conditions using a phone app. Last year, all site specifications, site photos, required permission forms, and weather observations were completed manually, scanned, and emailed to TPWD. Now that information can be gathered in one place, stored as a draft until the monitor is retrieved, and submitted through the app.
During monitoring, sound files are saved to an SD card. When the monitor is retrieved, the sound files are loaded to a computer. Wild Acoustics software, Kaleidoscope Pro (KPro), is used to analyze the bat calls. The program’s Auto-ID function will denote the level of identification certainty for the bat sound files.
During monitoring, sound files are saved to an SD card. When the monitor is retrieved, the files are downloaded to a computer. Wild Acoustics software, Kaleidoscope Pro (KPro), is then used to analyze the bat calls. The program's Auto-ID function assigns a level of identification certainty to each bat call.
Kaleidoscope Pro creates a spreadsheet with each row representing a WAV file from the SD card.
Kaleidoscope Pro creates a spreadsheet in which each row represents a WAV file from the SD card.
The KPro Auto-ID identifies the bat species from the WAV files. The number of pulses and match ratio are the columns that tell whether the bat species heard is considered Highly Likely, Likely, Possible or Needs More Data. The rubric for this determination is outlined below:
The KPro Auto-ID identifies bat species from the WAV files. The pulse count and match ratio determine whether a species identification is classified as Highly Likely, Likely, Possible, or Needs More Data. The rubric for this determination is outlined below.
PLACEHOLDER for CHART
Last year, while analyzing the data, rather than comparing each line of the spreadsheet to this chart, I created an algorithm to do it for me. It took a lot of trial and error to come up with =IF(AND(S2>=0.86,Q2>=15),"Highly Likely", IF(AND(Q2>=15,AND(S2>=0.75,S2<0.86)),"Likely", (IF(AND(Q2>=1,AND(S2<0.749,S2>=0.6)),"Possible",(IF(AND(S2<0.6,S2>0.01),"Needs More Data"," ")))))))
(For those true computer geeks reading this, this algorithm wouldn’t work for this year as the pulse count for Possible has been changed from Any to 5-14.)
Last year, rather than comparing each line of the spreadsheet to the chart manually, I created an algorithm to do it for me. It took a lot of trial and error to develop.
(For the true computer geeks reading this, the algorithm would not work this year because the pulse-count requirement for the Possible category has changed from Any to 5–14.)
I also used conditional formatting to assign colors to these four categories so that I could spot at a glance the highest level of certainty for a species. Reporting a bat species required looking at the WAV file categories hierarchically. If a single bat species had WAV files that showed it was Likely, Possible, and Needs More Data, it would be recorded as Likely and reported as such to the landowner and NABat.
I also used conditional formatting to assign colors to the four categories so that I could quickly spot the highest level of certainty for a species. Reporting a bat species required looking at the WAV file categories hierarchically. If a species had WAV files categorized as Likely, Possible, and Needs More Data, it would be recorded as Likely and reported as such to the landowner and NABat.
This year, a Highland Lakes Master Naturalist, Bill Sewell, has created a program that further analyzes the data that KPro creates and automatically creates a report for the landowner. It also creates the summary file we submit to TPWD at the end of the season. A huge thank you from all the bat monitoring analyzers to Bill for turning what took an hour or more per site to the click of a button!
This year, Highland Lakes Master Naturalist Bill Sewell created a program that further analyzes the data generated by KPro and automatically produces a report for the landowner. It also creates the summary file submitted to TPWD at the end of the season. A huge thank-you from all the bat-monitoring analysts to Bill for reducing what once took an hour or more per site to the click of a button.
In Hays County, there are 14 possible bat species present. Eight are Species of Greatest Conservation Need (SGCN). One is considered Threatened. Three have an unknown conservation status in Texas. And two are Species of Least Concern.
In Hays County, 14 bat species may be present. Eight are Species of Greatest Conservation Need (SGCN). One is considered Threatened. Three have an unknown conservation status in Texas, and two are Species of Least Concern.
Last year, the number of bat species heard at each site was very dependent on the availability of water. Most landowners had 8-10 bat species heard on their property. I live in a community that doesn’t have a stream, creek, or pond. There were only 4 bat species heard here.
Last year, the number of bat species detected at each site was highly dependent on the availability of water. Most landowners had eight to 10 bat species recorded on their property. I live in a community that doesn't have a stream, creek, or pond, and only four species were detected here.
This year, with the abundance of rain, a few sites have recorded 11 bat species. The rain can have the opposite effect on the recordings as well, as bats don’t like to forage during the rain and the rain itself is recorded as noise.
This year, with the abundance of rain, a few sites have recorded 11 species. Rain can have the opposite effect on recordings as well, because bats generally do not forage during rain events and the rain itself is recorded as noise.
To support bats in your neck of the woods, plant native plants. These attract the insects necessary to feed these flying mammals. Though you may not see or hear bats, our acoustic monitoring is proving that they are much more prevalent than you think!
To support bats in your neck of the woods, plant native plants. These attract the insects that feed these flying mammals. Though you may not see or hear bats, our acoustic monitoring is proving that they are much more prevalent than many people realize.